

Student Placement Tracker and College Analytics for Faculty
See every job and internship your students applied to, what stage each application reached, and the batch-level charts your placement report needs.
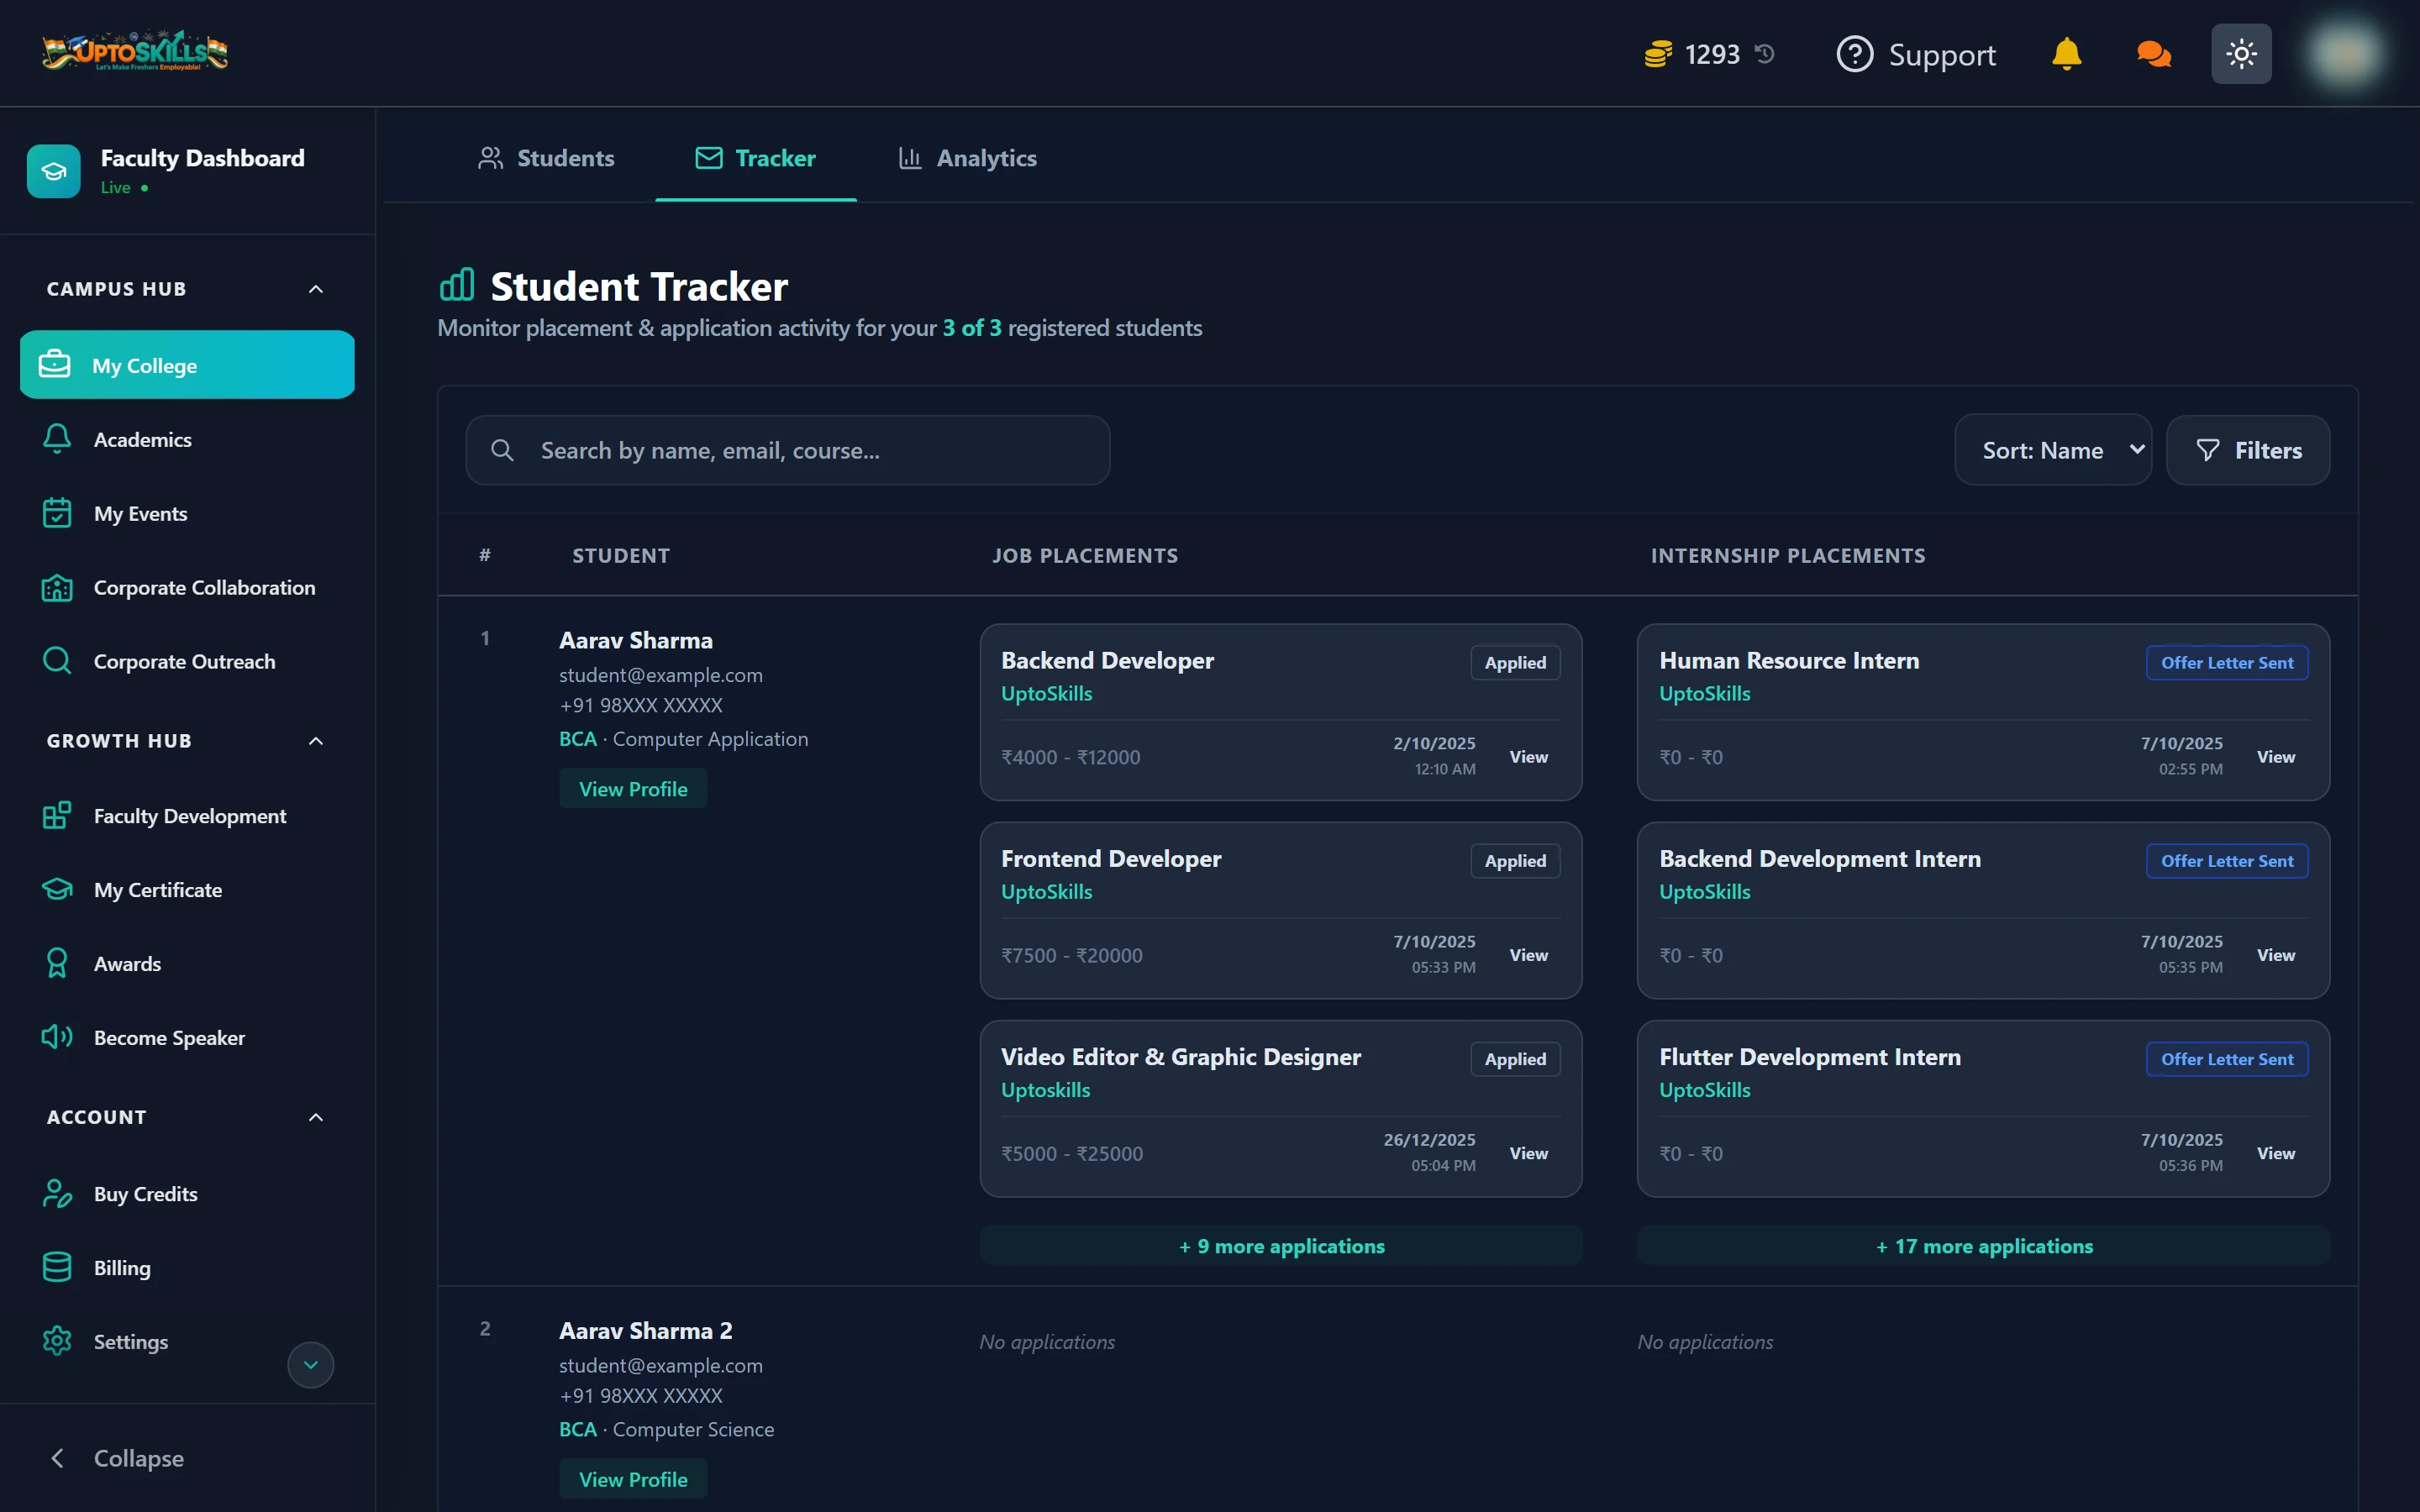
Short answer: My College → Tracker shows each student's live application list. My College → Analytics turns the same data into charts you can filter by batch. Neither needs any input from students — it updates as they apply.
The Tracker
One row per registered student, split into two columns:
- Job Placements — every job they applied to
- Internship Placements — every internship
Each application card shows the role, the company, the stage badge, the salary or stipend range, and the date applied. Where a student has more than three, a + N more applications link expands the rest.
What do the stage labels mean?
| Stage | What has happened |
|---|---|
| Applied | Application submitted, employer has not moved on it yet |
| Offer Letter Sent | The employer has made an offer |
Stages come straight from the employer's own hiring pipeline, so they update without anyone in your college touching them.
Sorting and filtering
- Search by name, email or course
- Sort by name, or by salary ascending/descending — useful for finding your top offers quickly
- Filters narrows to a batch or course
- View Profile opens the student's full profile
The Analytics tab
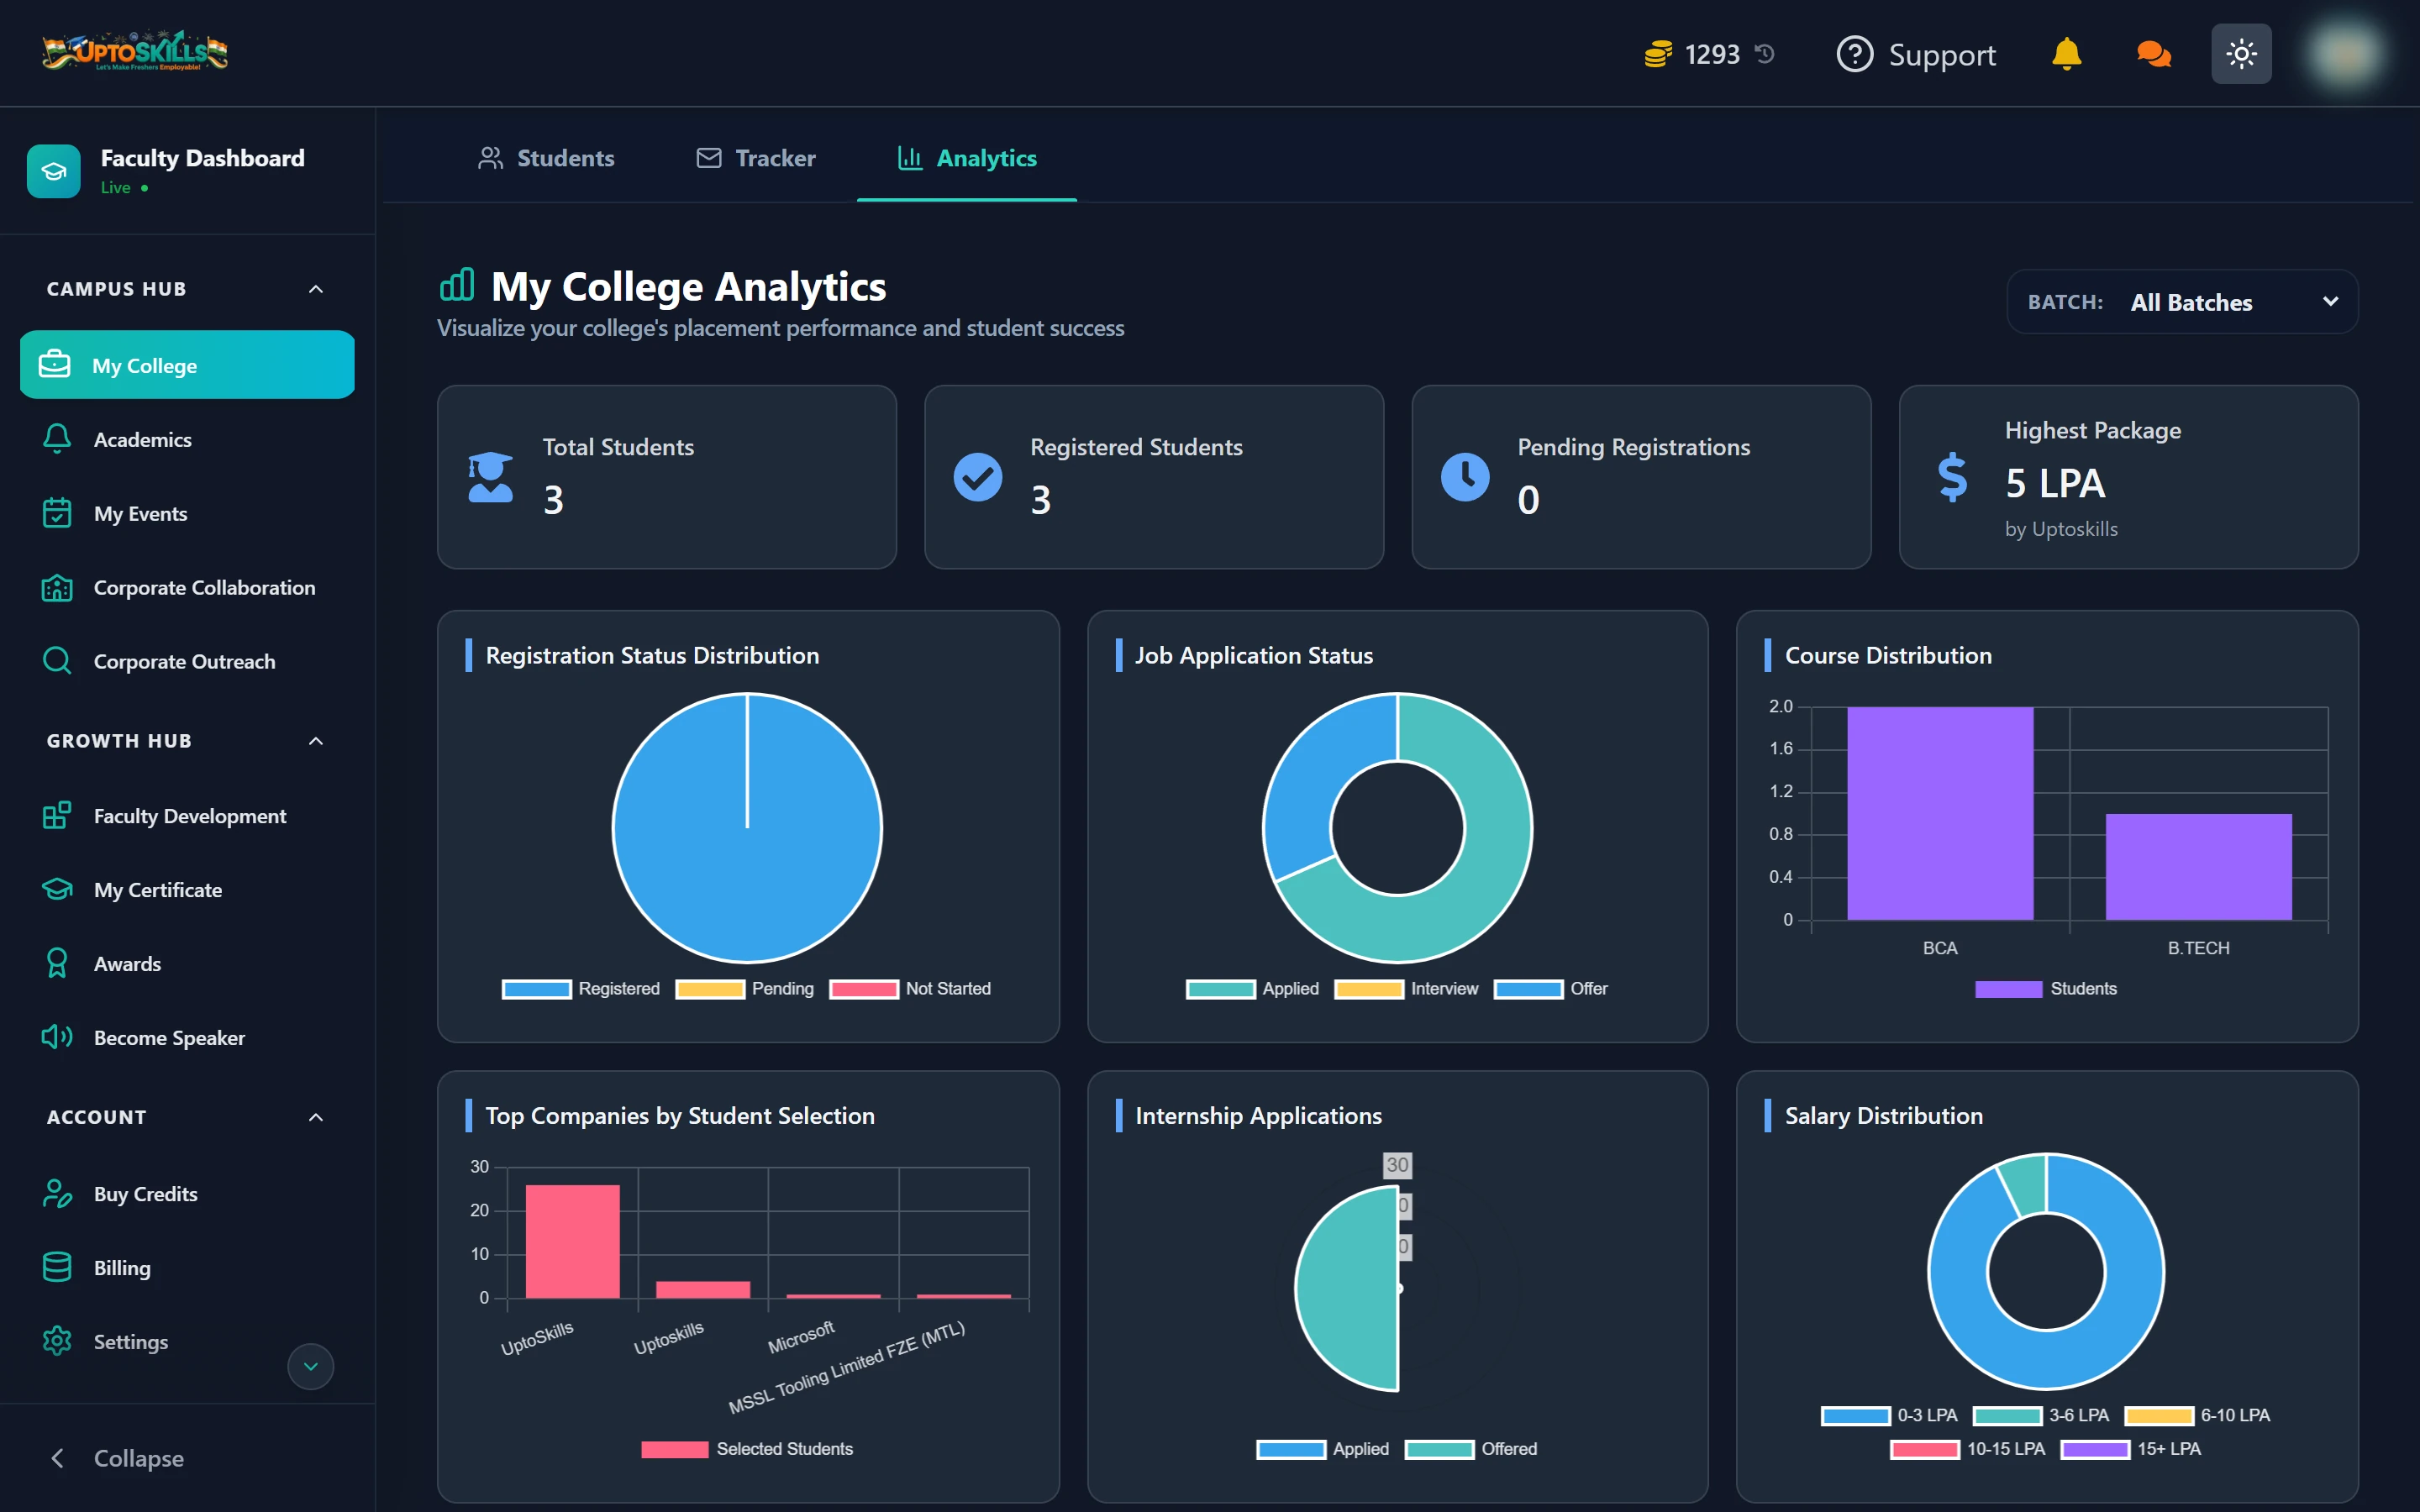
Four headline numbers across the top — Total Students, Registered Students, Pending Registrations and Highest Package, with the company that offered it. Below those, eight charts:
| Chart | What it answers |
|---|---|
| Registration Status Distribution | How much of the roster has actually signed up |
| Job Application Status | Where applications are stalling across the whole batch |
| Course Distribution | Which courses your students come from |
| Top Companies by Student Selection | Which recruiters actually hire from you |
| Internship Applications | Internship activity, separate from full-time |
| Salary Distribution | The shape of your package spread, not just the top figure |
| Student Activity Overview | Who is actually using the platform |
| Email Status | Whether your invites and notices are landing |
📈 The BATCH dropdown at the top filters every chart at once. Set it to a single graduating batch when you are writing that batch's placement report.
Using this for your annual placement report
- Set the batch filter to the graduating year
- Highest Package and Top Companies give you the headline figures
- Salary Distribution gives you the median picture, which is the honest one
- Registration Status tells you what share of the batch the numbers actually cover
Why is a student missing from the Tracker?
The Tracker only covers registered students. Someone still on Invites Sent has no account yet, so there is nothing to track. Resend their invitation from the Students tab.
Do students see that I am tracking their applications?
Students know their college is linked to their account — they accepted your invite to create it. You see application activity and outcomes, which is exactly what a placement cell needs to do its job.
Does this include applications to companies outside UptoSkills?
No. It covers applications made through UptoSkills. An offer a student got directly from a company will not appear here.
Can I export this data?
There is a download control on the Students tab for the roster. The charts are read on screen — most faculty screenshot the ones they need for their report.